
6+6 steps to optimize Javascript on React websites
Part 3 of our React Performance series

Welcome to the React Performance Optimization series on systemseed.com. It’s a practical guide to improving performance of mature or even legacy React websites without significant refactoring.
Catch up on the previous sections:
- Part 1: Don't optimize your Javascript! Do this instead
- Part 2: 7 essential tools for web performance audits
In this article, we will go through the process of Javascript code optimization: 6 steps to optimize dependencies and another 6 steps to fix your custom code. Follow us on Twitter to read the next parts as they get published.
Optimize dependencies for performance
Bespoke code is known for its high maintenance costs, but third-party libraries aren't free either. In React-based websites, most Javascript code comes from external dependencies. A large collection of plug-n-play NPM packages is a huge React strength, and developers try to get the most of it. When left unmonitored, it can result in unexpected issues, including low performance. So our journey of Javascript optimization starts with reviewing dependencies.

Source: https://github.com/webpack-contrib/webpack-bundle-analyzer#webpack-bundle-analyzer
1. Analyze
First, review your production build with a specialized tool like Webpack Bundle Analyzer.
Beware though, reducing the bundle size doesn't automatically improve Web Vitals. You need to audit the entire application after each improvement suggested below. See Part 2 to learn more about performance audit tools.
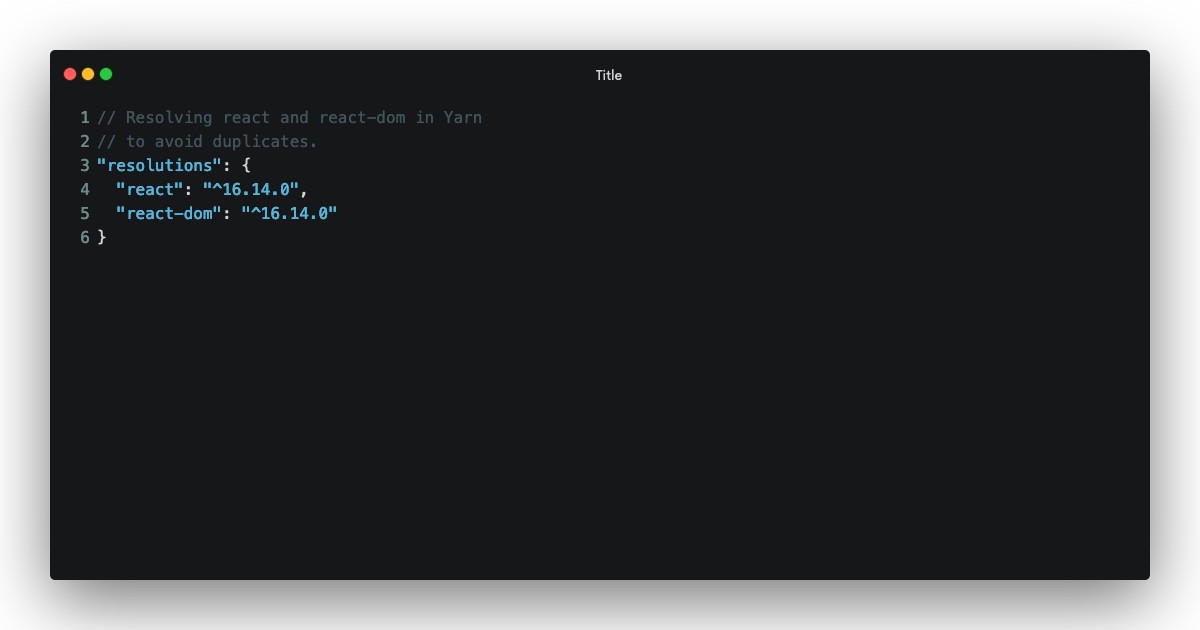
2. Remove duplicates
The first issue you may notice is that multiple versions of the same library are included in the production bundle. For example, your app can contain two different React versions. This is a huge overhead for a client-side application.
You can resolve this issue by carefully updating dependent packages or forcing the appropriate version in resolutions.
3. Apply performance updates
It's not always possible to keep all dependencies up to date, but older versions can become inefficient as technologies evolve.
Review your largest dependencies and check whether their newer versions introduce performance optimizations. Check their release notes and compare bundle sizes on Bundlephobia. If the library is no longer supported, replace it with an alternative.
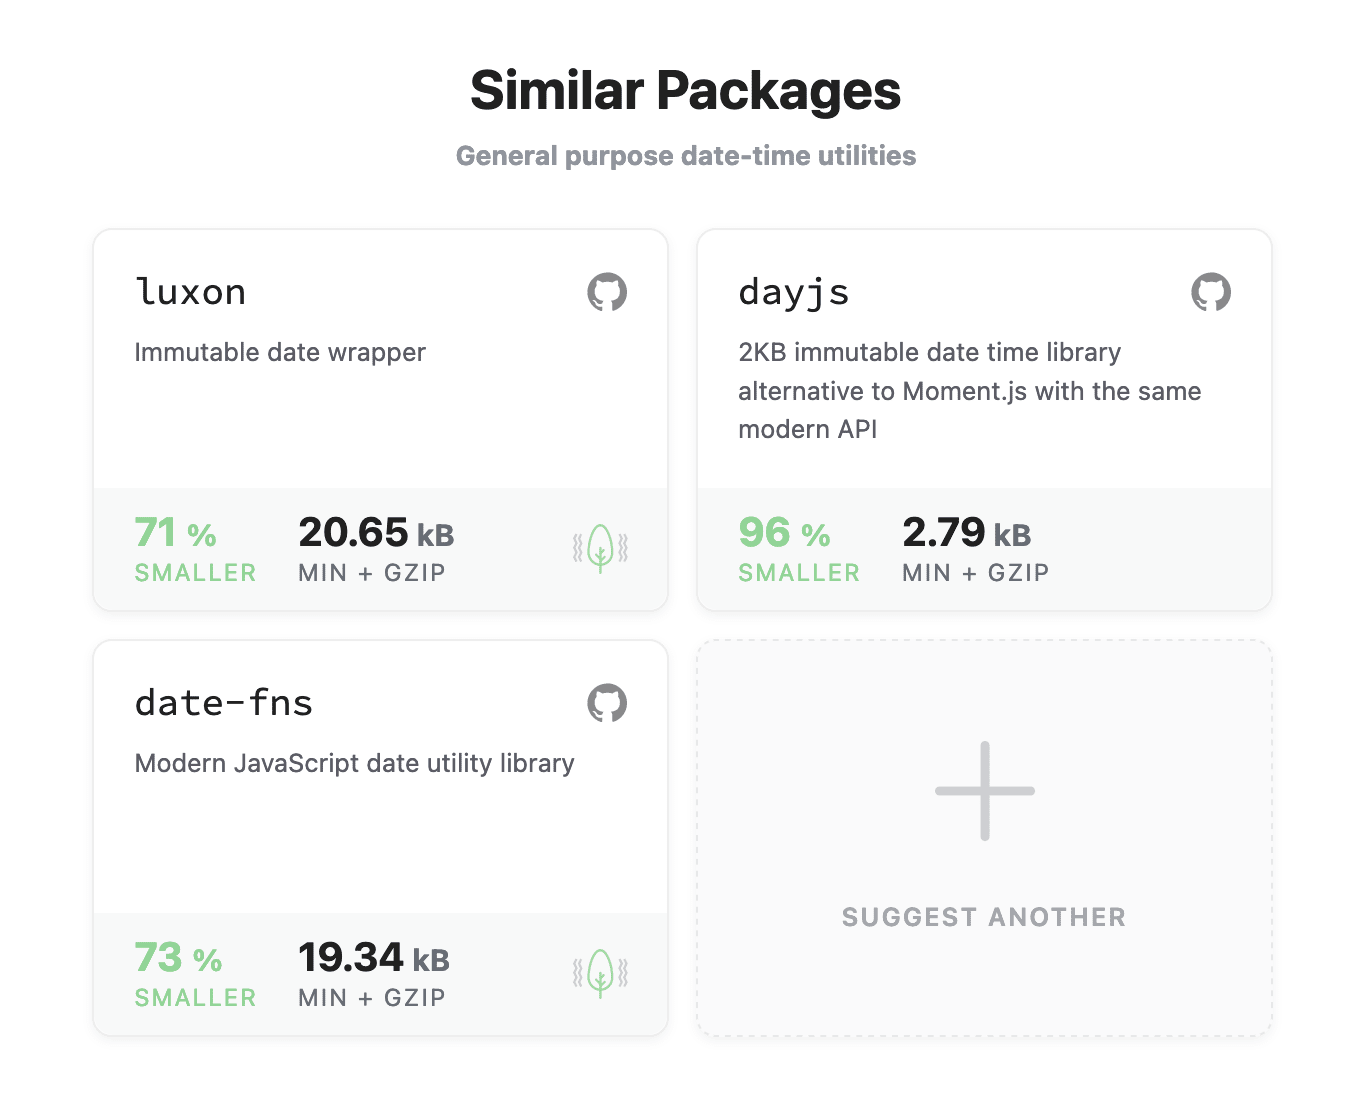
4. Replace with alternative
The classic example of this optimization technique is the moment.js library. Go to Budlephobia again and check out similar packages, e.g. date-fns. Of course, size shouldn't be the only criterion for your choice, but it should always be considered.
5. Remove a dependency
In other words, rewrite a piece of the application without a dependency. A simple regexp can replace a third-party HTML parser. A thin fetch wrapper can replace axios. Browser built-in loading property can replace a Javascript lazy loading implementation. CSS animations can be much cheaper than Javascript-based alternatives and so on.
In each individual case, you need to follow common sense, and often the optimal solution would be to use a well-tested external library rather than maintaining your own code.
6. Think for the long term
It's great to see a performance boost after a one-off optimization, but it's equally important to maintain this result in the long run. The following recommendations can help build a good dependency management strategy:
Don't add dependencies before you need them
It's tempting to create a boilerplate with all the “useful” libraries pre-installed - don't do that with client side applications.
Share dependency ownership with the entire development team
Every developer on the team should be comfortable managing and using application dependencies.
Embrace the boring technology
The Javascript community is known for releasing the new best state manager every week. Think twice before adding a shiny new library to your application though.
Keep dependencies (reasonably) up to date
Very frequent updates may be overwhelming, but outdated packages can slow down developers and introduce bugs. Find your balance. Tools like Dependabot or Snyk can help automate the process.
Optimize custom code
Poor performance is effectively a bug as it requires debugging, fixing and preventing in the future. There are many performance tools out there, but unfortunately, none of them will tell you how to fix your code. To catch a performance issue, apply the same techniques as for bug hunting. The following 6 steps will help you go through the process.
1. You don't need to be a Javascript/React expert to get started
It's tempting to postpone performance work due to a lack of “expert knowledge”. The truth is that this kind of knowledge is obtained and maintained through practice. You already have all the necessary skills to get started. Be prepared to take a lot of notes and run a lot of experiments. Eventually, this will become your expert knowledge. A good understanding of your own codebase will help too.
2. Define steps to reproduce
Just like with any other bug, you need concrete steps to reproduce it. You can use Web Vitals or other measurables, e.g. First Contentful Paint for the mobile home page, time to render the results of a search query, memory consumption after using the app for 10 min, etc. Know what you are trying to improve.
3. Localize the suspicious code
Now is the right time to take a good look at the Chrome and React profilers mentioned in Part 2. They are best used in combination with the detailed steps to reproduce: start the profiler, follow the steps, stop the profiler, review, document, repeat.
If you have never used the profilers before, take your time to learn the interface. In the next part we will debug a test application to get familiar with both tools. In the meantime you are welcome to check-out their documentation:
- https://developer.chrome.com/docs/devtools/evaluate-performance/reference/
- https://reactjs.org/blog/2018/09/10/introducing-the-react-profiler.html
Don’t fix anything yet! Our goal at this stage is to understand how the problematic part of the application works and come up with a list of potential contributors to the performance issue identified. If there are no obvious candidates for fixing, then just pick any one. You need to start somewhere.
4. Confirm and prioritize your findings
As we mentioned in Part 1, Javascript code inefficiencies are not always the main contributor to poor site performance. Is it worth spending weeks reworking the application without Redux, if the overall performance boost will be 1%? In some cases the answer is yes, but more often it's a no.
The easiest way to measure the performance cost of the suspicious piece of code is to remove or to mock it, re-run the performance checks and compare the results. For example, you can completely comment-out an event handler or replace an API request with a mock object.
Repeat the same process for each performance optimization candidate you have identified, and carefully note down your results. Then, prioritize your findings considering the potential savings and complexity.
What if you didn't find anything significant? You are looking in the wrong place. Start again from your steps to reproduce, try another profiler or logging mechanism, throttle network & CPU to make issues more visible.
5. Implement the fixes
In real life, there will be multiple issues that have to be fixed, but let's imagine we identified only one significant performance issue. We know how to reproduce it, we found the code that creates it and we know what to measure to validate the fix. So, we can finally fix it!
First of all, look at the problematic piece of code and compare it with the framework documentation. Does the code violate any known best practices? Are some methods or patterns in your code known for bad performance? Many bugs are caused by typos, uncareful coding or API misuse.
In other cases, the fix will require deep knowledge of Javascript and React. At this stage, you can gather it quickly enough as you have already localized your problem. The Internet is full of useful advice if you know how to ask.
Finally, there are cases when it's not possible to “fix” the issue. You can work on the UX to make “waiting” easier for the user, you can wait for the industry to come up with the fix, or at the very least you can make the entire team aware of the issue - eventually, you as a team will find a better solution.
6. Think for the long term
The Javascript ecosystem moves at a fast pace and your codebase evolves with every new feature, too. The following recommendations will help avoid unnecessary performance bugs and simplify the code optimization process for your team:
Avoid premature optimization
Always measure potential savings before jumping into non-obvious optimizations.
Integrate community best practices in your linting
Preconfigured ESLint rule sets (1, 2, 3, 4) accumulate wisdom of hundreds of experienced developers. Googling an ESLint error that prevents me from committing always teaches me something new.
Optimize your production build
Employ tools like Webpack, Browserlist, PostCSS, PurgeCSS to minify and optimize your code automatically.
Practice profiling
Performance work becomes much easier with practice. In the next article we will walk through a simple profiling process together.
Help your team learn React & Javascript performance fundamentals
React performance isn't about useMemo or PureComponent, it's about understanding the framework as a whole and when to use what. Encourage your team to learn about web fundamentals and framework best practices.
And of course, share your feedback about this series. What was unclear or missing? I’d like to know.
Final note
Where to start with a Javascript performance optimization project? We broke it down into 6+6 practical steps to help you navigate this complex task. The first 6 steps cover dependency management as they often generate the major part of your JS bundle. The other 6 steps teach us how to approach bespoke code inefficiencies and why it's important to learn the fundamentals.
This is it for part 3 of the React Performance Optimization series on systemseed.com. Follow us on Twitter to read the next part as it gets published. Next time we will learn how to use Chrome and React profilers.